I waited 8 hours in a Niagara Falls emergency department to get a consultation for my wife. In India, the same visit would usually take minutes. So I asked the question an operations analyst would ask about a slow warehouse: where is the bottleneck, and what is the cheapest way to move it?
Want the plain-language version? Read the article Why are ER wait times so long in Canada? The real reasons, and how to fix them.
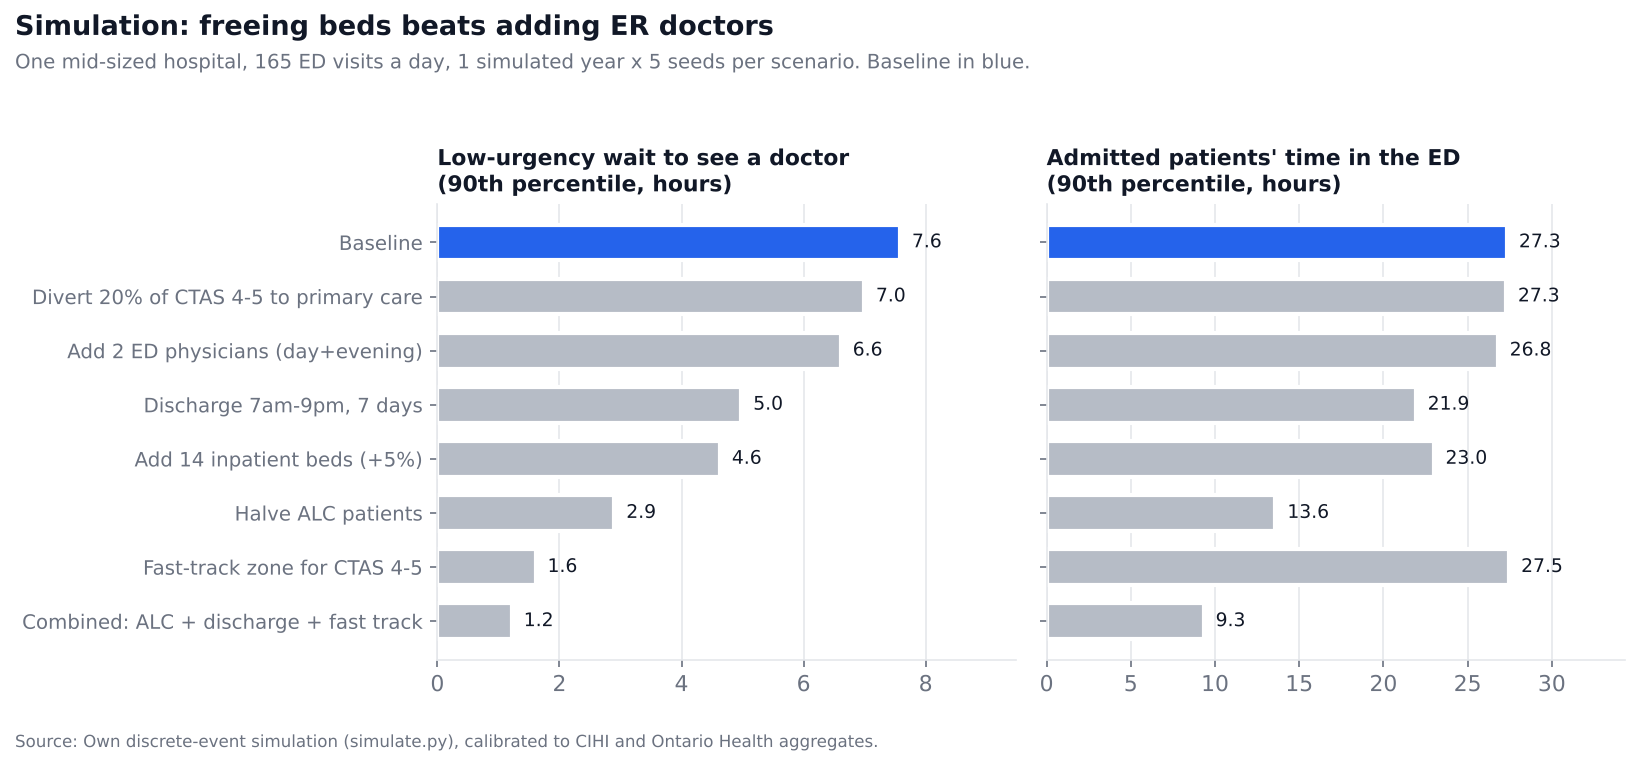
Short answer: it is mostly not money, and mostly not the ER. Canada spends about as much per person as its peers. The constraint is inpatient beds. They are 91% full, and about one bed day in six goes to patients who are medically ready to leave but have nowhere to go. Admitted patients then wait in the ER for a bed (2.5 days on average at Niagara Health). They hold the stretchers and nurses that low-urgency patients are queueing for. In my simulation, halving those “alternate level of care” (ALC) patients cuts the low-urgency 90th-percentile wait from 7.6 to 2.9 hours. Adding two ER doctors only gets it to 6.6 hours.
1. Treat the hospital like a supply chain
A patient’s visit is a chain of queues, and the chain moves only as fast as its slowest link:
- Front door: about 5.9 million adults have no family doctor or nurse practitioner, and only 37% of those who do can be seen the same or next day. So the ER becomes the walk-in clinic.
- Triage: patients are sorted by CTAS acuity, from 1 (resuscitation) to 5 (non-urgent). A low-urgency visit like mine is CTAS 4 or 5 and always goes to the back of the queue.
- Treatment space and physician: you can only be seen once there is a stretcher or chair with a nurse.
- Decision: 88% go home and 12% are admitted.
- Boarding: admitted patients wait in the ER until a ward bed is free.
- Ward: beds run at 91% occupancy.
- Exit: discharge is blocked when the patient needs long-term care, home care or rehab that isn’t available. These are ALC patients, with a median stay of 24 days against 4 for other admitted ER patients.
The key logistics point is that a blocked exit blocks the entrance. One patient boarding in the ER for 56 hours takes up a space that could have seen dozens of low-urgency patients.
2. What the public data says
 ↓ Download PNG
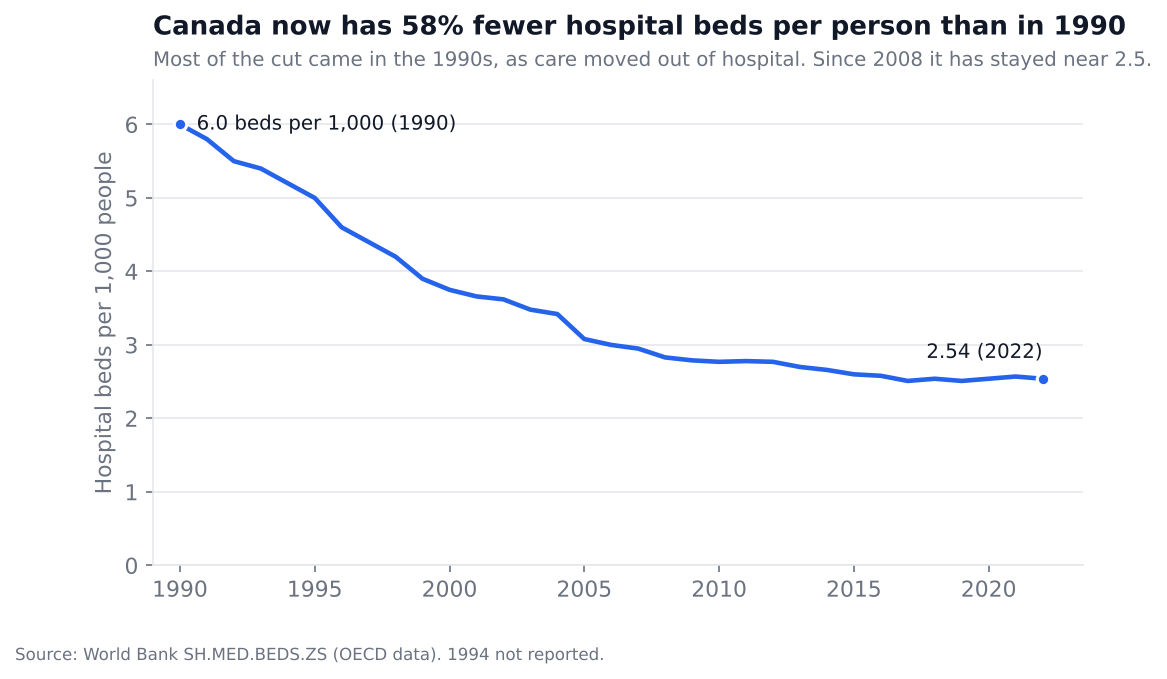
Canada cut its hospital beds per person from 6.0 to 2.54 between 1990 and 2022. Most of the cut came in the 1990s, and the number has stayed flat while the population has aged.
 ↓ Download PNG
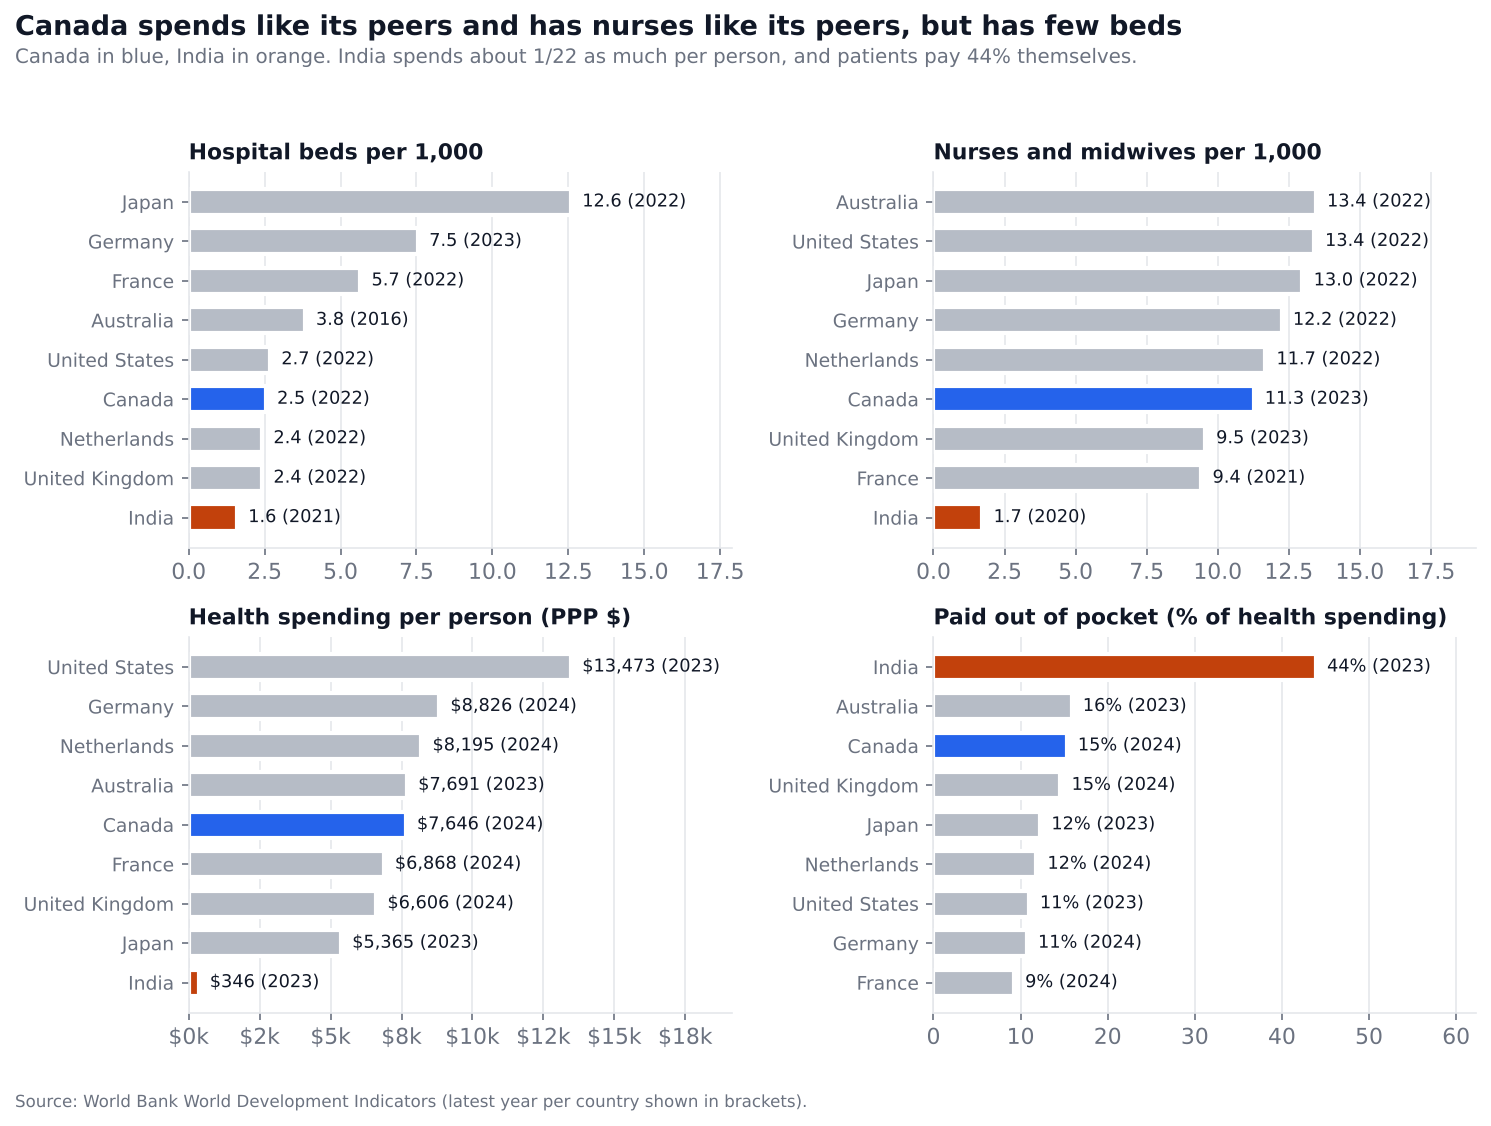
Is money the problem? Not on its own. Canada spends $7,646 per person (PPP), close to Australia ($7,691) and above France and the UK. It has about as many nurses per person as its peers. Beds are the outlier. Canada has 2.5 per 1,000, against 5.7 in France and 7.5 in Germany. The UK and the Netherlands have as few beds as Canada, so beds alone don’t explain everything. What matters is how full the beds are kept and how fast patients can leave them.
 ↓ Download PNG
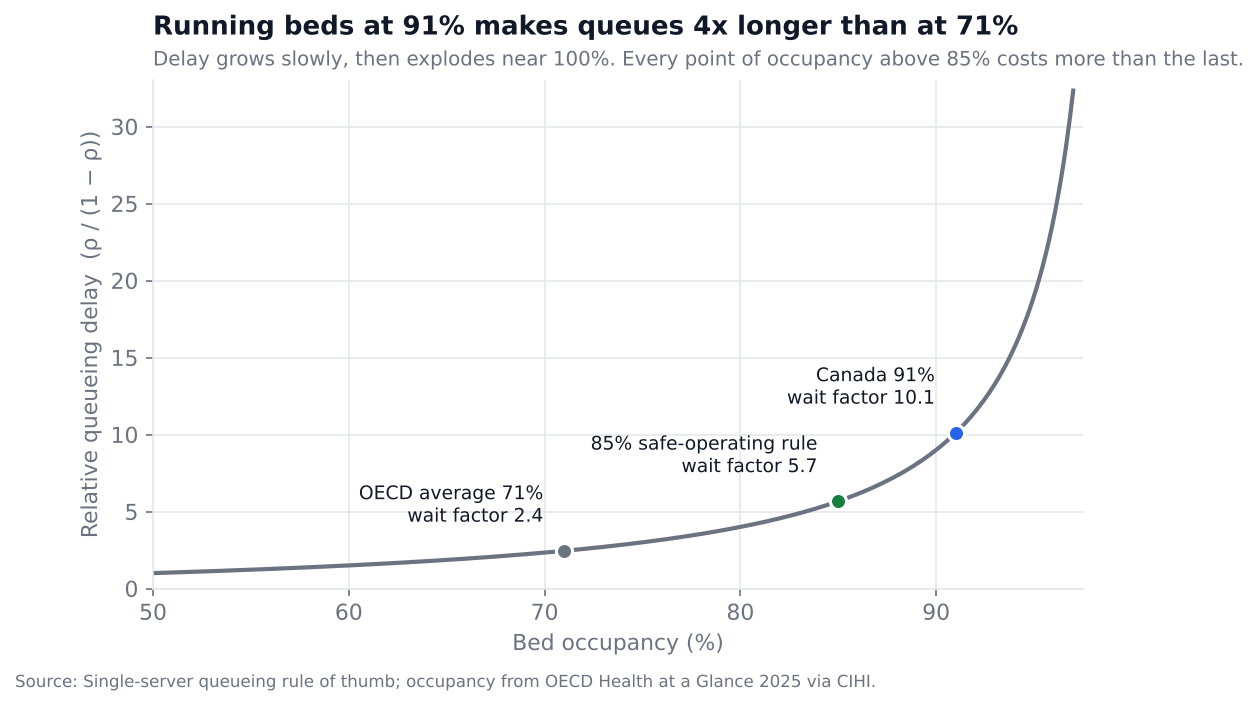
Why 91% full is a crisis, not a statistic. In queueing theory, waiting time grows roughly with ρ / (1 − ρ), where ρ is how full the system is. At the OECD average of 71% that factor is 2.4. At Canada’s 91% it is 10.1, about four times worse. Hospitals, like ports and warehouses, need slack to absorb surges. The usual safe-operating rule is 85%.
 ↓ Download PNG
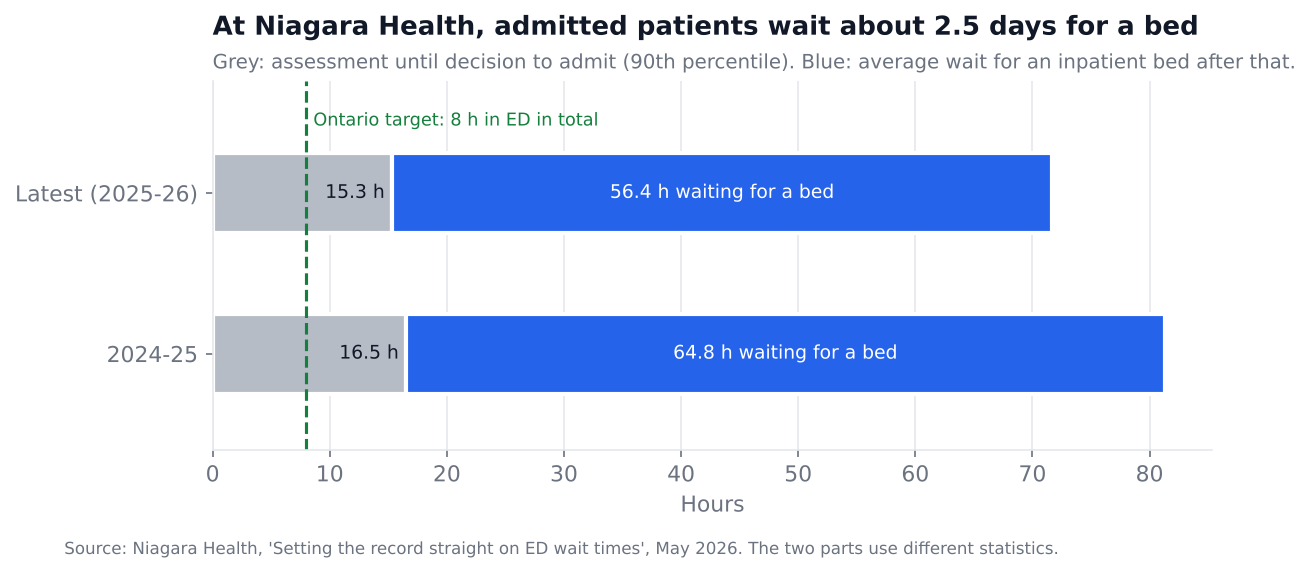
Niagara. Niagara Health reports that 90% of patients reach a decision to admit within 15.3 hours. Those admitted then wait an average of 56.4 hours for a bed, down from 64.8 hours in 2024-25. Ontario’s target is 8 hours in the ER in total, and province-wide only 26% of admitted patients make it. Greater Niagara General, St. Catharines and Welland each averaged 2.3 hours to first assessment in January 2026, against 1.7 hours across Ontario.
National context (CIHI, 2024-25): half of ER patients see a doctor in just under 2 hours, but 1 in 10 low-urgency patients waits more than 5.9 hours. 1 in 10 patients spends more than 14 hours in the ER in total (up 28% since 2018-19), and 7.7% leave without being seen.
 ↓ Download PNG
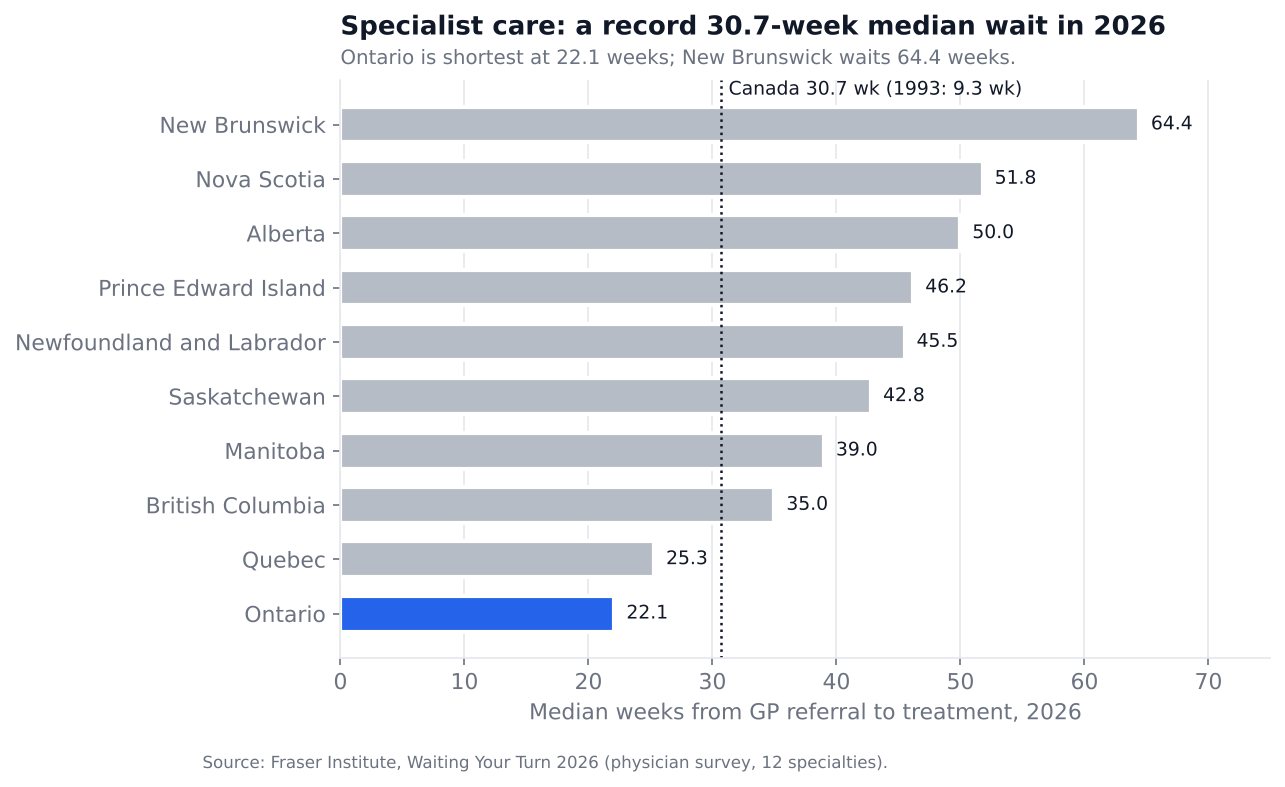
Common services are a second queue. The median wait from a GP referral to treatment by a specialist hit a record 30.7 weeks in 2026, up from 9.3 weeks in 1993. MRI waits are 18.1 weeks and CT waits 9.7 weeks. Ontario is the shortest at 22.1 weeks. People who are waiting come back to the ER when they get worse, adding to the front-door demand.
3. Why India feels faster
India rations care by price, while Canada rations it by queue. India spends about $346 per person, roughly 1/22 of Canada’s spending. It has fewer beds (1.6 per 1,000), far fewer nurses (1.7 per 1,000) and fewer doctors (0.7 per 1,000, against 2.8 in Canada). It still feels fast because a large private sector lets anyone who can pay walk straight into a specialist or a private hospital, with no referral and no queue behind boarded patients. Private capacity grows where paying demand is, like on-demand logistics. The cost is that patients pay 44% of all health spending themselves (Canada: 15%), and access is very uneven between private city hospitals and public rural care. India’s speed comes from elastic, price-sorted capacity, not from having more resources.
Lessons Canada can borrow without the out-of-pocket cost: separate fast lanes for simple cases (India’s walk-in clinics and diagnostic centres), extended hours, and direct access to diagnostics and some specialists.
4. The simulation: which lever fixes the 8-hour wait?
I built a discrete-event simulation (simulate.py, standard library only) of one mid-sized hospital:
- 165 ER visits a day with a realistic arrival curve, and 33 treatment spaces.
- Physicians by shift: 3 at night, 5 during the day and 6 in the evening.
- 275 ward beds and 12 scheduled admissions a day, which are postponed when the ER is full of boarders.
- Discharges only between 11 am and 5 pm, and fewer at weekends.
- 5.5% of admitted patients become ALC, for a median of 24 extra days.
- Patients who wait too long may leave without being seen.
The baseline lands close to the published Canadian figures:
| Simulated baseline | Published | |
|---|---|---|
| Low-urgency wait to doctor, 90th pct | 7.6 h | 5.9 h (Canada, CTAS 4-5) |
| Admitted patients’ ER time, 90th pct | 27.3 h | 20.3 h avg (Ontario); 46.5 h 90th pct (Canada) |
| Left without being seen | 11.1% | 7.7% (Canada) |
| ALC share of bed days | 19.5% | 17% (Canada) |
Each scenario was then run for a simulated year with 5 random seeds:
 ↓ Download PNG
| Scenario | Low-urgency wait, 90th pct | Admitted ER time, 90th pct | Left without being seen | Electives postponed a week |
|---|---|---|---|---|
| Baseline | 7.6 h | 27.3 h | 11.1% | 9.0 |
| Divert 20% of CTAS 4-5 to primary care | 7.0 h | 27.3 h | 9.2% | 9.1 |
| Add 2 ER physicians | 6.6 h | 26.8 h | 9.5% | 8.7 |
| Discharge 7 am to 9 pm, 7 days a week | 5.0 h | 21.9 h | 7.0% | 3.1 |
| Add 14 ward beds (+5%) | 4.6 h | 23.0 h | 6.6% | 4.0 |
| Halve ALC patients | 2.9 h | 13.6 h | 3.4% | 1.3 |
| Fast-track zone for CTAS 4-5 | 1.6 h | 27.5 h | 4.7% | 11.1 |
| Combined: ALC + discharge hours + fast track | 1.2 h | 9.3 h | 1.1% | 0.0 |
What it shows:
- More ER doctors barely help while the ER is full of boarded patients, because the doctor is not the constraint. The stretcher is.
- Freeing ward beds fixes the whole chain. Halving ALC releases about a tenth of all bed days and cuts every wait downstream. Spreading discharges over 14 hours, 7 days a week, does about as much as building 14 new beds, at the cost of a staffing change.
- A fast track helps low-urgency patients right away, by giving them a lane that doesn’t compete with boarders. It does nothing for admitted patients.
- Diverting visits to primary care helps a little, because low-urgency patients take little ER time. Its value is mostly outside the ER, through earlier care and fewer patients getting worse.
- The combination is more than the sum of its parts. It takes occupancy from 99% to 93%, which is the steep part of the queueing curve, so every wait collapses.
5. Recommendations
- Make ALC the number one metric. Transitional care beds, faster long-term care placement and home-care surge teams. Each ALC patient moved to the right place frees an acute bed for a median of 24 days.
- Run discharge like a dock schedule. Plan discharges a day ahead, run weekend discharge teams, aim for discharges before noon, and use a live bed board that shows beds about to free up, not just empty ones.
- Open a fast-track zone staffed by nurse practitioners from 10 am to 10 pm for CTAS 4-5 patients.
- Target 85% occupancy, not 100%, and size each region’s bed base with queueing models, not averages.
- Fix the front door: attach people to family doctors, extend urgent-care hours, let pharmacists prescribe, and use virtual triage. This matters most for the specialist queue.
- Forecast arrivals and staff to the curve, by hour and day of the week, the way retailers staff checkouts.
6. What a data analyst can do about it
You don’t need to be a doctor to move these numbers. Most of these levers are data problems:
- Build the bottleneck dashboard. One view per hospital: arrivals by hour, time to first assessment, boarding hours, occupancy at midnight and noon, ALC count and days, and discharges by hour. Most hospitals report these separately, if at all. Seeing them together shows where flow breaks.
- Forecast demand. Hourly ER arrival and admission forecasts, using time-series models with weather, flu season and holidays, so managers can staff to predicted demand instead of history.
- Predict discharges. A model that flags, the day before, which patients are likely to go home tomorrow. The bed board then shows beds about to free up, and ALC risk is spotted early so placement can start on day 1, not day 10.
- Simulate before spending. A model like the one here lets a hospital test “add 14 beds” against “discharge until 9 pm” before spending millions.
- Measure with percentiles. Report 90th percentiles and the share meeting targets, not averages. The 8-hour wait lives in the tail.
- Automate the pipeline. Pull NACRS-style extracts, bed census and staffing rosters into one warehouse with data-quality checks, so the dashboard updates itself every day.
- Work with public data. Ontario Health, CIHI and Statistics Canada publish enough to rank hospitals, spot outliers and hold the system to its targets. That is how this study was done.
Data and code
Everything is in public/projects/canada-er-waits in this site’s repo: the tidy CSVs with a source URL on every row, simulate.py (standard-library Python) and analysis.py (pandas and matplotlib). To reproduce, run python simulate.py then python analysis.py.
Sources: CIHI, Wait Times in Canada 2026 and NACRS ED visits and lengths of stay · Ontario Health, Time Spent in Emergency Departments · Niagara Health, ED wait times article and QIP 2026-27 · World Bank World Development Indicators · Fraser Institute, Waiting Your Turn 2026 · C.D. Howe Institute, Addressing Canada’s Bed-Blocker Problem · OurCare survey 2025 via Unity Health Toronto.
Limitations
- The simulation is one stylised mid-sized hospital calibrated to published Canadian and Ontario averages, not to any hospital's patient records. It shows which lever matters most and by roughly how much, not exact hours for a real site.
- The model's median waits are shorter than CIHI's (about 2 hours) because it has no triage-to-room or nurse constraints; its 90th percentiles, walk-out rate and admitted-patient times are close to the published ones.
- Niagara Health publishes its low-urgency waits only as charts, so the 8-hour story is matched against the provincial and national 90th percentiles.
- Comparisons with India use World Bank national figures. They hide the large gap between private city hospitals and public rural care.
What's next
- Load Ontario Health's hospital-by-hospital monthly ED data and rank all Ontario EDs by boarding time.
- Turn the simulation into an in-browser what-if tool: move the sliders for ALC, beds, discharge hours and fast track.
- Add CIHI's ALC tables by region and estimate how many acute beds each region would free.
Run it on your own data
- In the browser (today)Free, no sign-up. What you enter stays on your device. Good for trying it and for small teams.
- On your files or databasePoint the same logic at your exports or a database view (PostgreSQL, SQL Server, Azure SQL or DuckDB), on your own machine or network.
- As a pipeline and warehouseA scheduled ETL job pulls from your systems (reservations, point of sale, inventory, payroll) into a star-schema warehouse, runs data-quality checks, and the tool or a Power BI report reads the result every morning.
How I'd set it up for you
I'd map your exports or database to the tool's model, package the job in a container that runs on your server or cloud account, add the checks your data needs, and hand over the code and a runbook. Your data stays on your systems. Get in touch if you'd like it fitted to your business.