I waited 8 hours in a Niagara Falls emergency department to get my wife seen. In India, the same visit would usually take minutes. I’m a data analyst, so I asked the question I’d ask about any slow operation, like a warehouse or a port: where is the bottleneck, and what is the cheapest way to move it?
So I treated Canada’s ER crisis like a supply-chain problem. I collected public data from CIHI, Ontario Health, Niagara Health, Statistics Canada, the World Bank and the Fraser Institute, then built a hospital flow simulation to test which fixes actually move the wait. This article is the plain-language version of that study: why ER wait times are so long in Canada, and what would fix them.
Key takeaways
- The ER is not the bottleneck. The hospital is. Canadian acute beds run about 91% full, against an OECD average of 71%.
- About 17% of acute bed days go to patients who are medically ready to leave but have nowhere to go (alternate level of care, or ALC).
- Admitted patients then board in the ER for hours or days, holding the stretchers and nurses everyone else is waiting for.
- A shortage of family doctors sends extra low-urgency visits to the ER, and those patients are always at the back of the queue.
- In my simulation, adding two ER doctors cut the low-urgency wait (90th percentile) only from 7.6 to 6.6 hours. Halving ALC patients cut it to 2.9 hours, and a three-part fix cut it to 1.2 hours.
Why are ER wait times so long in Canada? The short answer
ER waits are long in Canada because patients cannot leave the hospital fast enough, so new patients cannot get in. It is a blocked exit, not a slow entrance.
Think of a hospital as a chain of queues: the front door, triage, a treatment space, a doctor, a decision, a ward bed, and finally discharge. A chain moves only as fast as its slowest link. In Canada that link is near the end. Ward beds are nearly always full, partly because many of them hold patients waiting for long-term care or home care. So admitted ER patients wait in the ER for a bed. They take up treatment spaces, so the people in the waiting room wait longer.
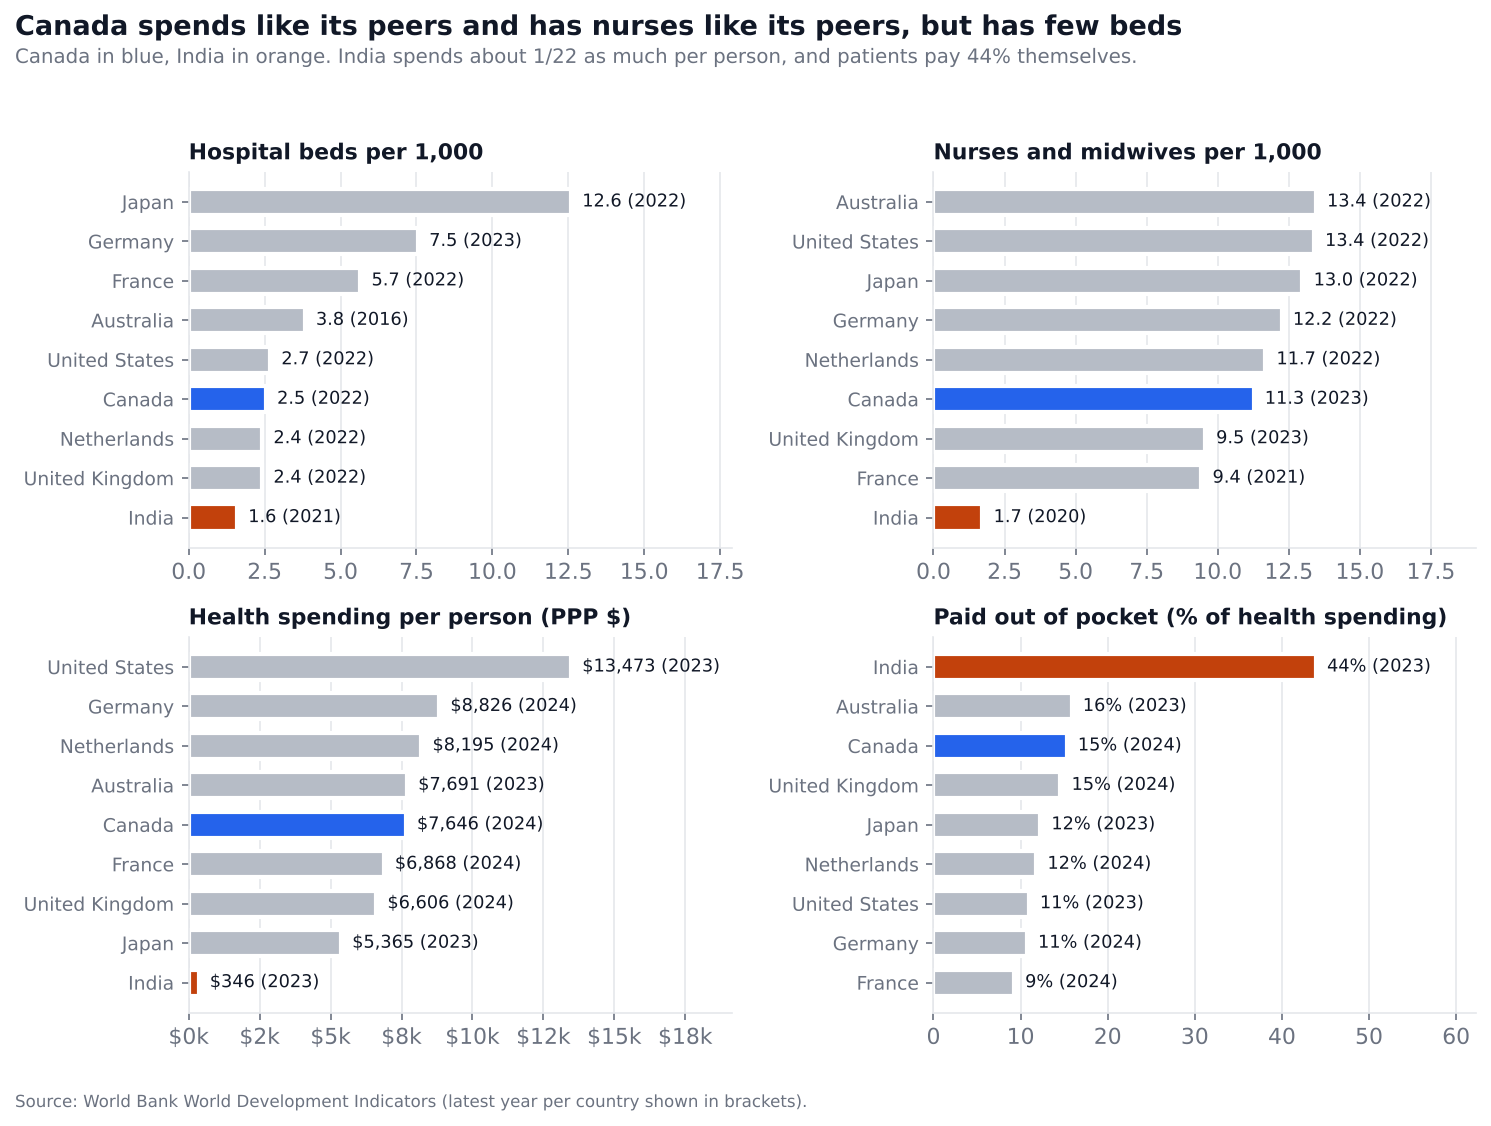
Money is not the main issue either. Canada spends about $7,646 per person on health care (World Bank, PPP), close to Australia ($7,691) and more than France or the UK. What stands out is how few beds Canada has and how full it keeps them.
How long are ER waits in Canada right now?
The national numbers from the Canadian Institute for Health Information (CIHI, Wait Times in Canada 2026) for 2024-25:
| Measure (Canada, 2024-25) | Value |
|---|---|
| Unscheduled ER visits a year | about 16 million |
| Median wait to see a doctor | just under 2 hours |
| Low-urgency (CTAS 4-5) wait to see a doctor, 90th percentile | 5.9 hours |
| Median total time in the ER | about 4 hours |
| Total time in the ER, 90th percentile | 14 hours (up 28% since 2018-19) |
| Patients who left before seeing a doctor | 7.7% |
| Admitted patients’ time in the ER, 90th percentile (2025-26) | 46.5 hours |
Two things jump out. First, the averages look tolerable, and the tail is terrible. Most people are seen within a couple of hours, but 1 in 10 spends more than half a day in the ER. Second, admitted patients spend the longest: 1 in 10 is in the ER for nearly two days, and CIHI counted about 180,000 admitted patients who waited more than 48 hours. Those long stays are not treatment. They are waiting for a bed.
Reason 1: Hospital beds are full, all the time
This is the root cause, and it is the one that gets talked about least.
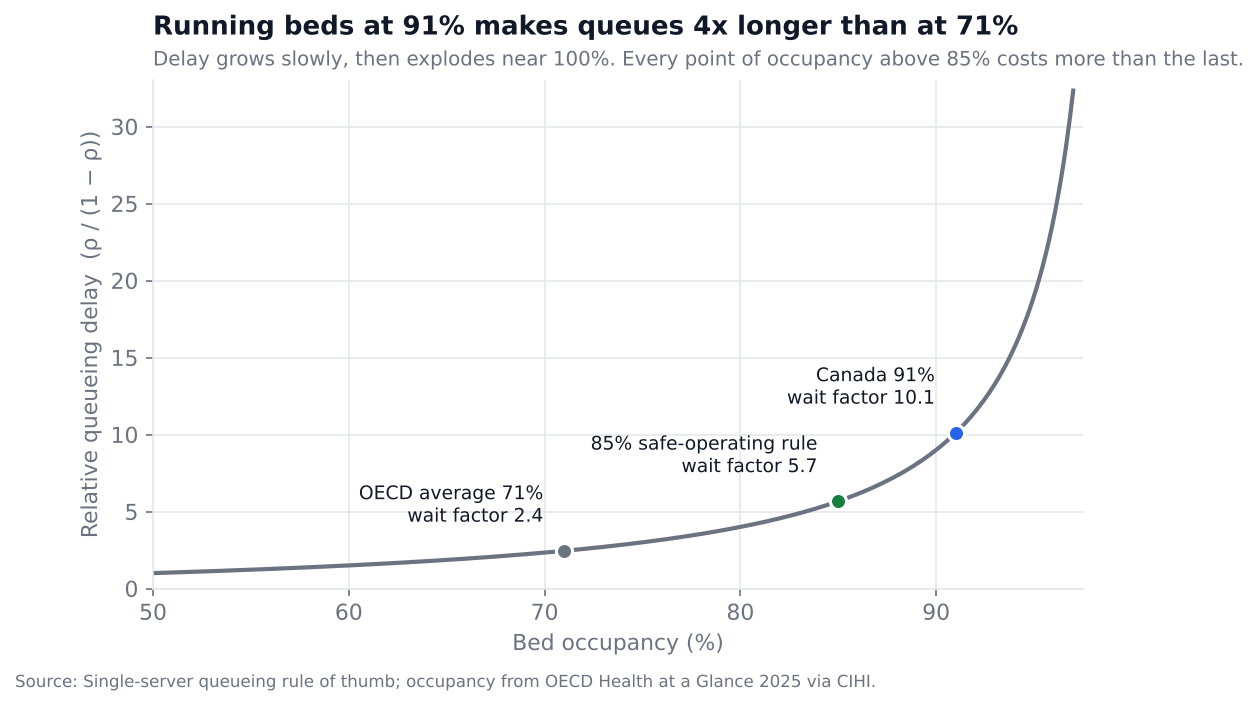
According to OECD figures reported by CIHI, Canada’s acute-care beds were 91% occupied in 2023. The OECD average was 71%.
That gap matters far more than it sounds, because queues don’t grow in a straight line. In queueing theory, waiting time grows roughly with ρ / (1 − ρ), where ρ is how full the system is:
- At 71% full, that factor is about 2.4.
- At 85% full (the usual safe-operating target), it is about 5.7.
- At 91% full, it is about 10.1.
 ↓ Download PNG
So a hospital at 91% doesn’t have waits 28% longer than one at 71%. It has waits roughly four times longer, and it has no slack for a bad flu week, a bus crash or a Monday morning. Ports, warehouses and call centres all learned this the hard way. Hospitals need spare capacity to absorb surges.
Reason 2: Patients who are ready to leave can’t (the ALC problem)
Why are the beds so full? A large part of the answer is alternate level of care (ALC) patients. These are people who no longer need an acute hospital bed but cannot be discharged, usually because a long-term care bed, home care, or a rehab place isn’t available.
- About 17% of acute bed days in Canada (outside Quebec) went to ALC patients in 2022-23 (CIHI data, via the C.D. Howe Institute).
- About 8% of admitted ER patients end up designated ALC, and their median hospital stay is 24 days, against 4 days for other admitted ER patients (CIHI, via Canadian Healthcare Technology).
In other words, roughly one bed in six is occupied by someone waiting for care somewhere else. In logistics terms, it’s a warehouse where a sixth of the shelves hold goods that have already been sold but can’t be shipped because the trucks aren’t coming.
This is a failure between parts of the system. The hospital can’t fix it alone, because the fix is in long-term care, home care and community services.
Reason 3: Admitted patients “board” in the ER for hours or days
When a patient is admitted but there is no ward bed, they stay in the ER. This is called boarding, and it is the mechanism that turns a bed shortage upstairs into an 8-hour wait downstairs.
A boarded patient occupies a stretcher, and needs nursing care, monitoring and medication. One patient boarding for two days uses a treatment space that could have seen dozens of low-urgency patients.
The local numbers show how big this is:
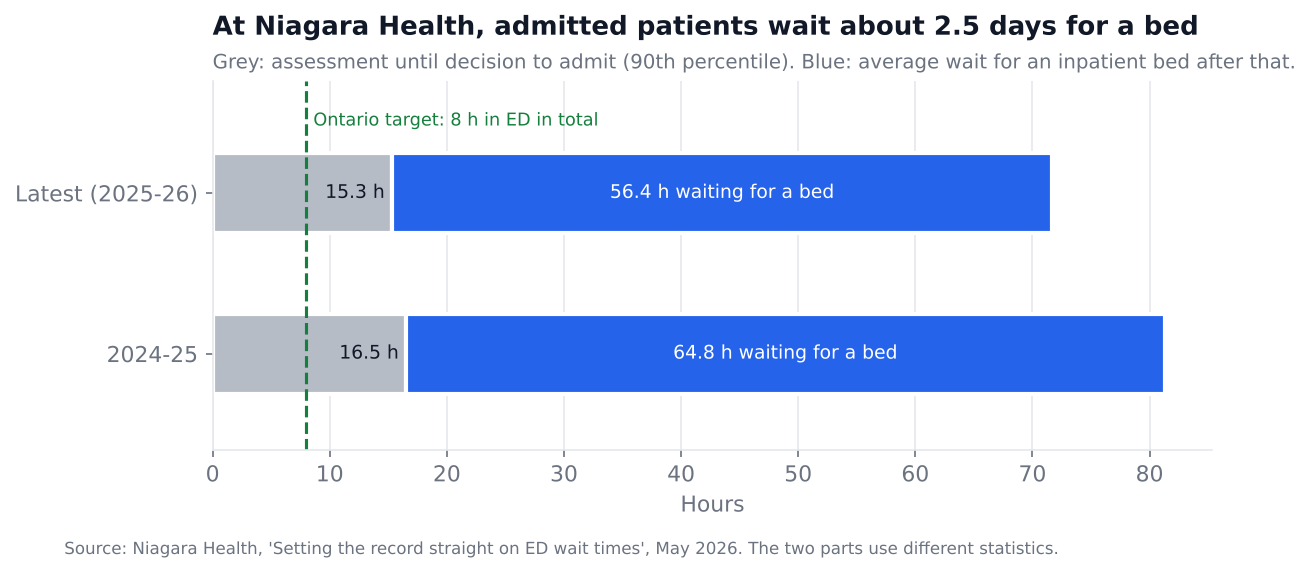
- Ontario: the target is that admitted patients spend no more than 8 hours in the ER. In January 2026, only 26% met it, and admitted patients spent 20.3 hours on average (Ontario Health).
- Niagara: after the decision to admit, patients waited an average of 56.4 hours for an inpatient bed, down from 64.8 hours the year before (Niagara Health).
 ↓ Download PNG
Boarding also slows ambulances. When there’s no stretcher, paramedics have to stay with their patient until one frees up. Niagara Health’s 90th-percentile ambulance offload time was 97 minutes in 2025 (Niagara Health Quality Improvement Plan 2026-27).
Reason 4: Millions of people have no family doctor, so the ER becomes the walk-in clinic
The front door of the system is primary care, and it’s overloaded too.
- About 5.9 million Canadian adults have no regular family doctor or nurse practitioner.
- Only 37% of people who do have one can get an appointment the same or next day.
(Both from the OurCare survey 2025, via Unity Health Toronto.)
When you can’t see your own doctor, the ER is the only place that’s always open. Many of these visits are low-urgency (CTAS 4 or 5) and could be handled in a clinic, by a pharmacist, or virtually. They don’t use much doctor time each, but they add up, and they sit at the very back of the queue behind every sicker patient and every boarder.
Reason 5: Canada cut hospital beds while the population aged
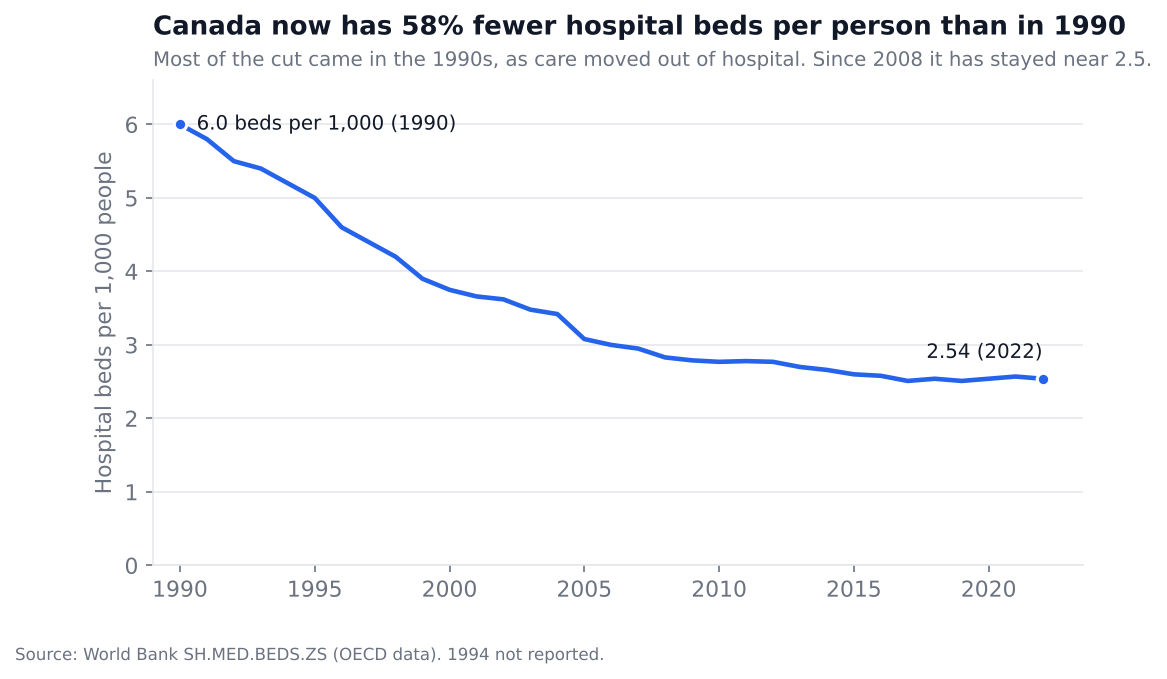
Canada had about 6.0 hospital beds per 1,000 people in 1990. By 2022 it had 2.54 (World Bank). Most of the cut happened in the 1990s, and the number has stayed low since.
 ↓ Download PNG
Meanwhile, the population got older. On July 1, 2025, 19.5% of Canadians were 65 or older, about 8.1 million people, and that group grew 3.4% in a year while the number of children stayed flat (Statistics Canada). Older patients are more likely to be admitted, stay longer, and need long-term or home care when they leave, which feeds straight back into Reason 2.
 ↓ Download PNG
Beds alone don’t explain everything. The UK and the Netherlands have about as few beds per person as Canada (2.42 each). France has 5.65 and Germany 7.55. What matters is the combination: few beds, kept very full, with a slow exit to long-term and home care.
Reason 6: Staff shortages and rigid schedules
Staffing is a real constraint, especially outside cities. Statistics Canada reports that the job vacancy rate for health occupations nearly tripled from 2.1% to 5.8% between 2016 and 2024. In remote regions the vacancy rate was 9.3%, against 5.5% in more accessible regions (Statistics Canada, May 2026). That’s why small-town ERs in Ontario have had to close temporarily for nights or weekends, which sends their patients to the next town’s already-full ER.
The good news is that the crunch is easing: health vacancies in late 2025 were down almost a third from their pandemic peak. But staffing schedules are a problem that costs much less to fix. In many hospitals, discharges cluster in a narrow window on weekday daytimes, when the doctors who sign discharges, pharmacists and transport are around, and slow down at weekends. ER arrivals keep coming into the evening, every day of the week. When beds free up hours after the patients who need them arrive, boarding is guaranteed.
Reason 7: The long wait for specialists sends people back to the ER
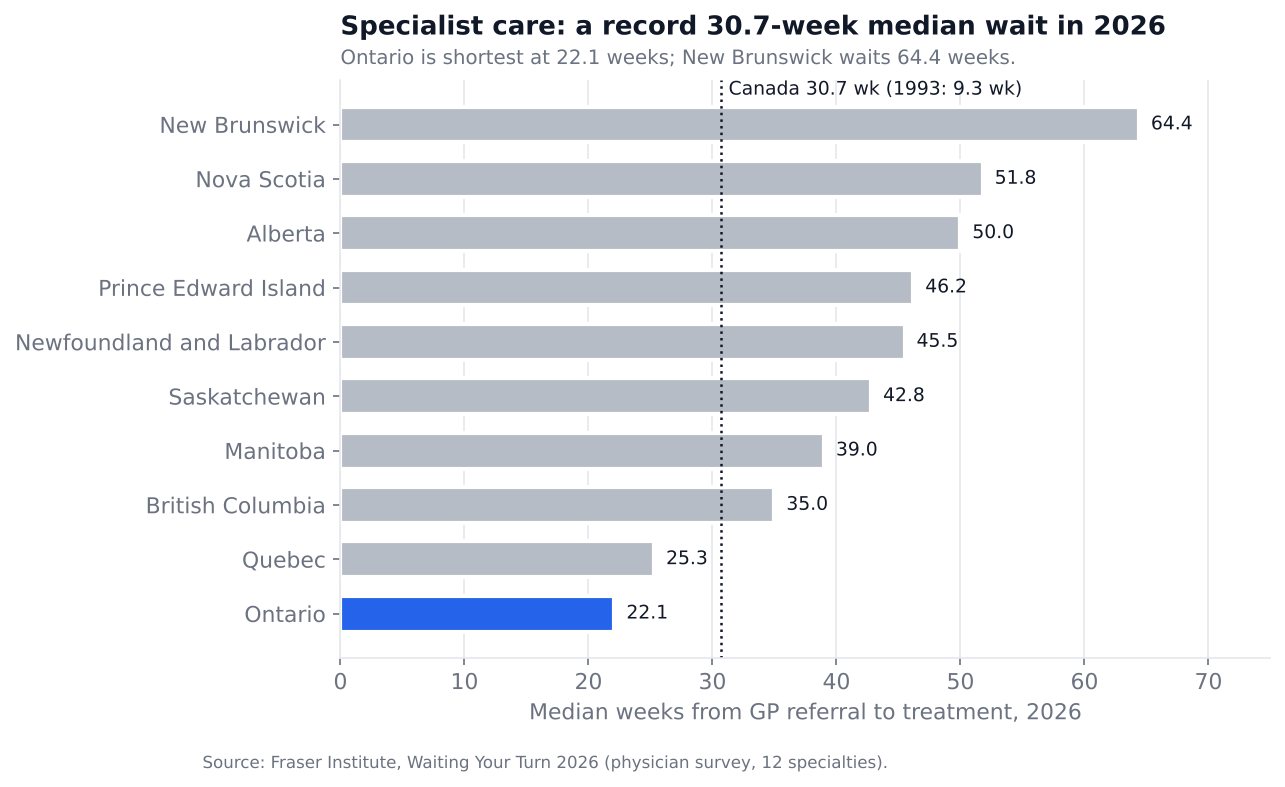
The second big queue in Canadian health care is for specialists and scans. The Fraser Institute’s Waiting Your Turn 2026 puts the median wait from a GP referral to treatment by a specialist at a record 30.7 weeks, up from 9.3 weeks in 1993. The median wait was 18.1 weeks for an MRI and 9.7 weeks for a CT scan.
 ↓ Download PNG
People who wait seven months for a specialist don’t stay still. Their condition gets worse, and many come back through the ER, adding to the demand at the front door. (The Fraser survey is a physician survey, so treat the exact numbers with some caution. The trend is clear.)
Is it a doctor shortage? What my simulation shows
The most common answer you’ll hear is “hire more ER doctors”. To test it, I built a discrete-event simulation of one mid-sized Canadian hospital, simulate.py, written in plain Python with no special libraries:
- 165 ER visits a day, arriving on a realistic daily curve, with 33 treatment spaces.
- 3 doctors at night, 5 during the day and 6 in the evening.
- 275 ward beds, with planned surgeries postponed when the ER is full of boarders.
- Discharges only between 11 am and 5 pm, and fewer at weekends.
- 5.5% of admitted patients become ALC, for a median of 24 extra days.
- Patients who wait too long may leave without being seen.
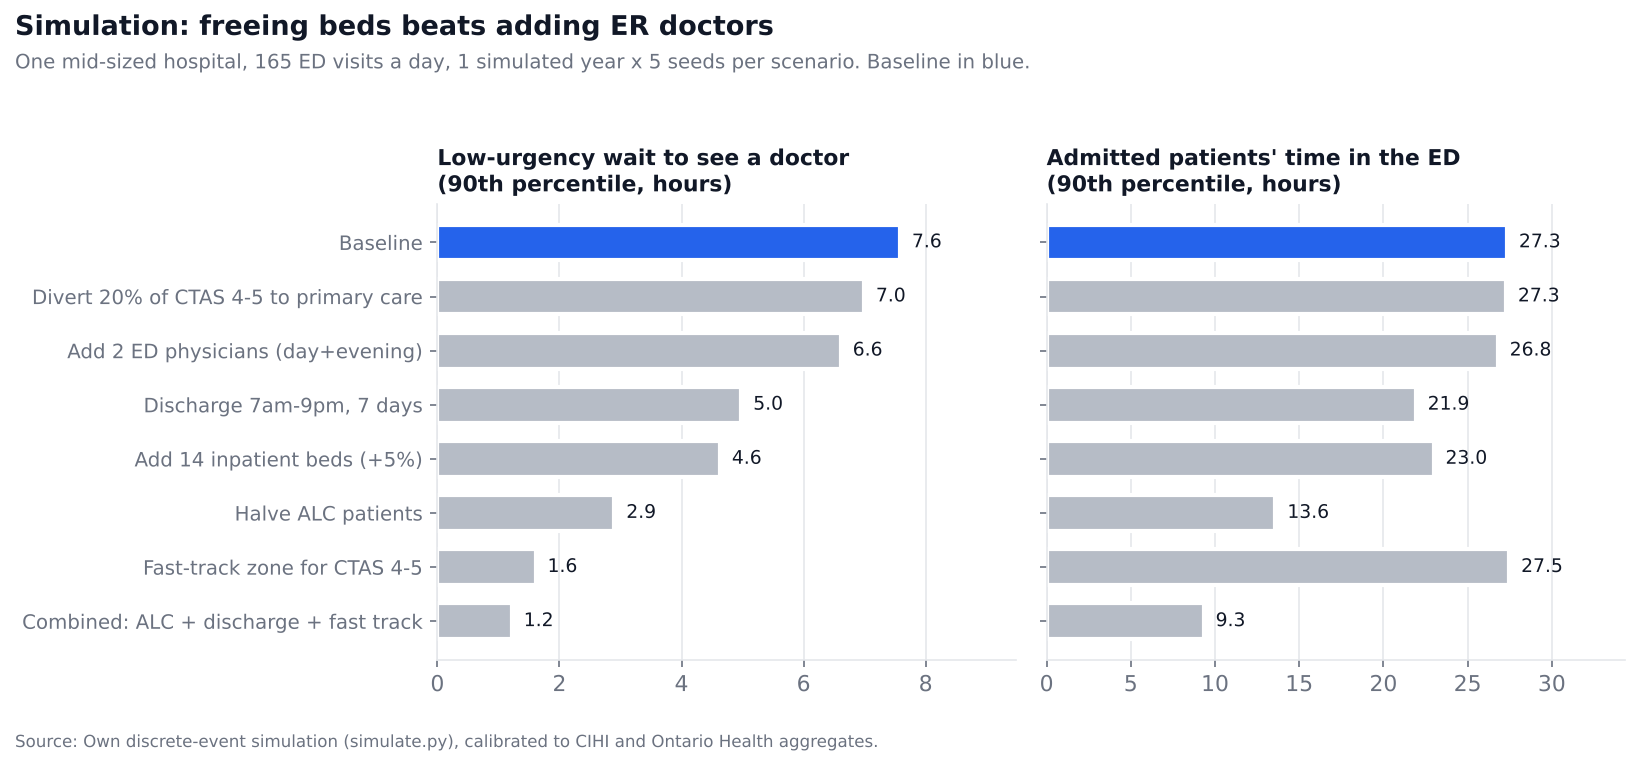
The baseline lands close to the real Canadian numbers: a low-urgency 90th-percentile wait of 7.6 hours (Canada: 5.9 hours), 11.1% leaving without being seen (Canada: 7.7%), and ALC taking 19.5% of bed days (Canada: 17%). Then I ran each fix for a simulated year, 5 times with different random seeds:
| Scenario | Low-urgency wait to a doctor, 90th pct | Admitted patients’ ER time, 90th pct | Left without being seen |
|---|---|---|---|
| Today (baseline) | 7.6 h | 27.3 h | 11.1% |
| Divert 20% of low-urgency visits to primary care | 7.0 h | 27.3 h | 9.2% |
| Add 2 ER doctors | 6.6 h | 26.8 h | 9.5% |
| Discharge 7 am to 9 pm, 7 days a week | 5.0 h | 21.9 h | 7.0% |
| Add 14 ward beds (+5%) | 4.6 h | 23.0 h | 6.6% |
| Halve ALC patients | 2.9 h | 13.6 h | 3.4% |
| Fast-track zone for CTAS 4-5 | 1.6 h | 27.5 h | 4.7% |
| Combined: ALC + discharge hours + fast track | 1.2 h | 9.3 h | 1.1% |
 ↓ Download PNG
What it shows:
- More ER doctors barely help while the ER is full of boarders, because the doctor isn’t the constraint. The stretcher is.
- Freeing ward beds fixes the whole chain. Halving ALC cuts every wait downstream, for walk-in and admitted patients alike.
- Spreading discharges over 14 hours a day, 7 days a week, does about as much as building 14 new beds, for the cost of a scheduling change.
- A fast-track zone fixes the low-urgency wait right away, because those patients stop competing with boarders for space. It does nothing for admitted patients.
- Together, the three changes take bed occupancy from 99% to 93%, off the steep part of the queueing curve, and every wait collapses.
This is one stylised hospital, calibrated to published averages rather than real patient records, so read it as “which lever matters most and by roughly how much”, not as exact hours for your local ER. The full method, data and code are on the project page.
Why ER care feels so much faster in other countries
People who have used both systems, me included, often compare them. In India, I’d usually see a doctor within minutes. But India isn’t faster because it has more resources. It spends about $346 per person (World Bank, PPP), about 1/22 of Canada, and has fewer beds (1.6 per 1,000) and far fewer nurses.
India feels fast because it rations care by price instead of by queue. A large private sector lets anyone who can pay walk straight into a specialist or a private hospital, with no referral. Private capacity grows wherever paying demand is. The cost is that Indian patients pay about 44% of all health spending out of their own pockets, against about 15% in Canada (World Bank), and access is very unequal.
Canada doesn’t need to copy that model to borrow its best ideas: separate fast lanes for simple cases, longer opening hours, and direct access to diagnostics.
My solution: a 6-part plan to cut ER wait times in Canada
Here’s what I would do, in order of impact. None of it requires building a new hospital first.
1. Make ALC the number-one metric
Every ALC patient moved to the right place frees an acute bed for a median of 24 days. Fund transitional care beds, speed up long-term care placement, and create home-care surge teams that can take a patient home within 48 hours. Start discharge planning on day 1 of an admission, not day 10, by flagging patients at high risk of becoming ALC as soon as they arrive.
2. Run discharges like a dock schedule
Plan tomorrow’s discharges today. Run discharge teams on evenings and weekends, aim for most discharges before noon, and show beds that are about to free up on a live bed board, not just beds that are already empty. In my simulation, this alone cut the low-urgency wait by a third.
3. Open a fast-track zone for low-urgency patients
A separate area, staffed by nurse practitioners and a physician from about 10 am to 10 pm, for CTAS 4 and 5 patients: sprains, cuts, infections, prescriptions. It gives the longest-waiting group a lane that doesn’t compete with boarders. Many Canadian hospitals already have one. The key is protecting it so it isn’t taken over for boarders on busy days.
4. Target 85% bed occupancy, not 100%
Size each region’s bed base with queueing models, not averages, so hospitals have slack for surges. Running at 91% looks efficient on a spreadsheet and is very expensive in practice.
5. Fix the front door with primary care, pharmacists and virtual triage
Attach people to family doctors and team-based clinics, extend urgent-care hours, let pharmacists treat more minor ailments, and offer virtual triage before people drive to the ER. In my simulation, diverting visits helped the ER only a little, but its bigger value is outside the ER: earlier care, fewer people getting worse, and a shorter specialist queue.
6. Forecast arrivals and staff to the curve
ER arrivals are very predictable by hour, day of the week, season and weather. Retailers staff checkouts to forecast demand, and hospitals can staff nurses, doctors and discharge teams the same way, instead of using fixed rosters based on history.
How data analysts can help fix ER wait times
Most of these levers are data problems, and you don’t need to be a doctor to move them:
- A bottleneck dashboard for every hospital: arrivals by hour, time to first assessment, boarding hours, occupancy at midnight and noon, ALC count and days, and discharges by hour, all in one view.
- Demand forecasts: hourly ER arrival and admission forecasts using flu season, weather and holidays (the same approach as my demand forecaster for hotels).
- Discharge prediction: a model that flags, the day before, who is likely to go home tomorrow, and who is at risk of becoming ALC.
- Simulate before spending: test “add 14 beds” against “discharge until 9 pm” before spending millions.
- Measure with percentiles, not averages: the 8-hour wait lives in the 90th percentile, and averages hide it.
What you can do while the system catches up
If you or someone with you might be having an emergency (chest pain, trouble breathing, signs of stroke, severe bleeding, a serious injury), go to the ER or call 911. Don’t let wait times put you off. Triage exists so the sickest people are seen first.
For minor problems, especially in Ontario:
- Call Health811 (dial 811) for free advice from a registered nurse, 24 hours a day.
- Ask a pharmacist. Ontario pharmacists can assess and prescribe for a list of common minor ailments.
- Try urgent care, a walk-in clinic or virtual care for things like minor infections, rashes, sprains and prescription renewals.
- Check your hospital’s posted wait times if it publishes them, and consider a nearby ER or urgent care centre that’s less busy.
The bottom line
ER wait times in Canada are long because the whole hospital is full, not because ER staff are slow. The fastest way to shorten the wait in the waiting room is to get patients who are ready to leave out of hospital beds, spread discharges across the day, and give low-urgency patients their own lane. That’s a logistics problem, and logistics problems can be solved.
If you work in a hospital, a health authority or a ministry and want to test these ideas on real data, I’d love to hear from you: contact me. The full study, with every dataset, chart and line of code, is on the Canadian ER wait times project page, and more of my work on health operations is on the health field page.
Sources: CIHI, Wait Times in Canada 2026, NACRS ED visits and lengths of stay and ED wait times: insights from a health system perspective · Ontario Health, Time Spent in Emergency Departments · Niagara Health, ED wait times and QIP 2026-27 · Statistics Canada, Population estimates by age, July 1, 2025 and The nursing crunch is easing · World Bank World Development Indicators · Fraser Institute, Waiting Your Turn 2026 · C.D. Howe Institute, Addressing Canada’s Bed-Blocker Problem · OurCare survey 2025, via Unity Health Toronto · CIHI figures on admitted patients waiting over 48 hours, via Global News. The data, with a source link on every row, is in ed_and_system_indicators.csv.
This article is about how the health system works, not medical advice. If you think you may have an emergency, call 911 or go to the nearest emergency department.
Frequently asked questions
Why are ER wait times so long in Canada?
Mainly because hospital beds are full. Canadian acute-care beds run about 91% full (OECD average: 71%), and about 17% of acute bed days go to alternate level of care (ALC) patients who are medically ready to leave but are waiting for long-term care, home care or rehab. Admitted patients then wait in the ER for a bed, taking up the stretchers and nurses everyone else is queueing for. A shortage of family doctors adds extra low-urgency visits at the front door.
How long is the average ER wait in Canada?
According to CIHI, for 2024-25, half of ER patients saw a doctor within just under 2 hours, and the median total time in the ER was about 4 hours. The tail is the problem: 1 in 10 patients spent more than 14 hours in the ER, up 28% since 2018-19, and 1 in 10 low-urgency (CTAS 4-5) patients waited more than 5.9 hours just to see a doctor.
Is the ER wait caused by a doctor shortage?
Only partly. A shortage of family doctors pushes more people to the ER (about 5.9 million Canadian adults have no regular family doctor or nurse practitioner). But inside the hospital, the bottleneck is usually beds and treatment spaces, not ER physicians. In my simulation, adding two ER doctors cut the low-urgency 90th-percentile wait only from 7.6 to 6.6 hours, while halving ALC patients cut it to 2.9 hours.
What is an ALC patient, and why does it matter for ER waits?
An alternate level of care (ALC) patient is someone in an acute hospital bed who no longer needs acute care but cannot be discharged, usually because a long-term care bed, home care or rehab place is not available. CIHI reports their median hospital stay is 24 days, against 4 days for other admitted ER patients. Every ALC bed is a bed the ER cannot send an admitted patient to, so the ER fills with boarders.
Why does my ER visit take so long if I'm not very sick?
Patients are triaged by the Canadian Triage and Acuity Scale (CTAS), from 1 (resuscitation) to 5 (non-urgent). Low-urgency patients are always seen after sicker ones, and they need the same scarce treatment spaces that are often occupied by admitted patients waiting for a ward bed. That is why the longest waits fall on CTAS 4 and 5 patients.
Why are ER waits so long in Ontario and Niagara?
Ontario's target is that admitted patients spend no more than 8 hours in the ER, but in January 2026 only 26% met it, and admitted patients spent 20.3 hours on average (Ontario Health). Niagara Health reports that admitted patients wait an average of 56.4 hours for an inpatient bed after the decision to admit. Its three main EDs averaged 2.3 hours to first assessment in January 2026, against 1.7 hours across Ontario.
What would actually reduce ER wait times in Canada?
Freeing ward beds fixes the whole chain. The biggest levers are moving ALC patients to long-term care, home care or transitional beds, spreading hospital discharges across the whole day and week, a separate fast-track zone for low-urgency patients, running beds at about 85% occupancy instead of over 90%, and better access to family doctors and urgent care. In my simulation, those three hospital changes together cut the low-urgency 90th-percentile wait from 7.6 hours to 1.2 hours.
Where should I go instead of the ER for a minor problem in Ontario?
For anything that could be an emergency, go to the ER or call 911. For minor problems, Ontario's Health811 (call 811) gives free 24/7 advice from a registered nurse, Ontario pharmacists can assess and prescribe for a list of common minor ailments, and urgent care centres, walk-in clinics and virtual care can handle many low-urgency visits.