The question
Fish schools, bird flocks, crowds, traffic, epidemics and wildfires have no leader, yet they keep order, limit their own growth and recover after a shock. Do they all follow the same few rules? If they do, those rules can be written down once and reused to steer drones, trucks, aircraft, grid batteries and fire crews.
This study measures every dataset the same way, from real recordings only. Simulations are labelled and never used as evidence.
The 25 datasets
| Group | Datasets | Source |
|---|---|---|
| Animal motion | tetra fish school, zebrafish groups, wild jackdaw flocks (3D), homing pigeons under a robotic predator, ant exploration | Zenodo |
| Human and machine motion | Lyon pedestrian crowds, NGSIM I-80 road traffic, OpenSky air traffic, 30-drone outdoor flock | Zenodo |
| Spreading | COVID-19 first wave in 26 countries, Twitter Higgs-boson cascade, Twitter 15M movement | JHU CSSE, Zenodo |
| Hazards | daily wildfire growth (US and Canada), Canadian wildfire evacuations, earthquakes, sunspots | Zenodo, SILSO |
| Ecology | Canadian lynx 1821 to 1934, Ontario Christmas bird counts | public R datasets |
| Socio-technical | ERCOT grid load, Capital Bikeshare rides, European stock indices | repo sample, R datasets |
| Cosmic | SPARC galaxy rotation curves, Pantheon+ supernovae, DESI DR2 BAO, cosmic chronometers | used on the swarm-universe page |
Ten more are listed but not yet used (swifts, starlings, locusts, honeybees, a 39-fish school, IESO, AESO, CWFIS, the USGS earthquake catalogue and Planck likelihoods), because they could not be downloaded from the cloud runner.
The general adaptive swarm equation (GASE)
For a collective level X (cases, area burned, grid load, active users, flock speed):
dX/dt = r X [1 - (X/K)^θ]  -  κ (X - X*)  +  F(t)  +  σ X^γ ξ(t)
        self-limiting growth  pull to set point  outside push  noise that grows with X
For agents that move, the same ideas become a local rule. Lengths are in nearest-neighbour distances and speeds in the group’s typical speed:
a_i = α (neighbours' mean velocity - v_i) + β (neighbours' centre - x_i) + γ (v0 - |v_i|) v_i/|v_i|
      alignment                               cohesion                      speed set point
What the real data say
| Characteristic | Result | What it means |
|---|---|---|
| Alignment | positive in 8 of 8 moving swarms; median α 0.16 (fish 0.35, drones 0.37, crowds 1.0, pigeons 0.03) | every swarm turns toward its neighbours’ heading, with very different strengths |
| Push-to-pull switch | median 0.96 neighbour distances (middle half 0.61 to 1.07, 7 swarms) | fish, birds, crowds, cars, aircraft and drones all switch from keeping apart to drawing together at about one neighbour distance |
| Self-regulation | 67% of 12 series are pulled back toward a level | most collective levels are regulated; growth phases (COVID, cascades) are not |
| Rises followed by falls | 83% of 12 series | regulation with overshoot. Caveat: differencing noisy data also produces this |
| Heavy tails | 70% of 10 event-size distributions have a tail exponent between 1 and 3 (median 2.3) | fires, quakes, cascades, evacuations and bird counts look near-critical, though most fit a lognormal equally well |
| Growth shape | Gompertz or Richards (θ < 1) wins for most fires and COVID waves | growth slows early: the swarm limits itself before it reaches its cap |
| Fluctuation scaling | median γ 0.90 | agents act together, not independently (that would be 0.5) |
| How much of each single move the rule explains | 0.3% to 13% | the rule describes average tendencies, not individual moves |
 ↓ Download PNG
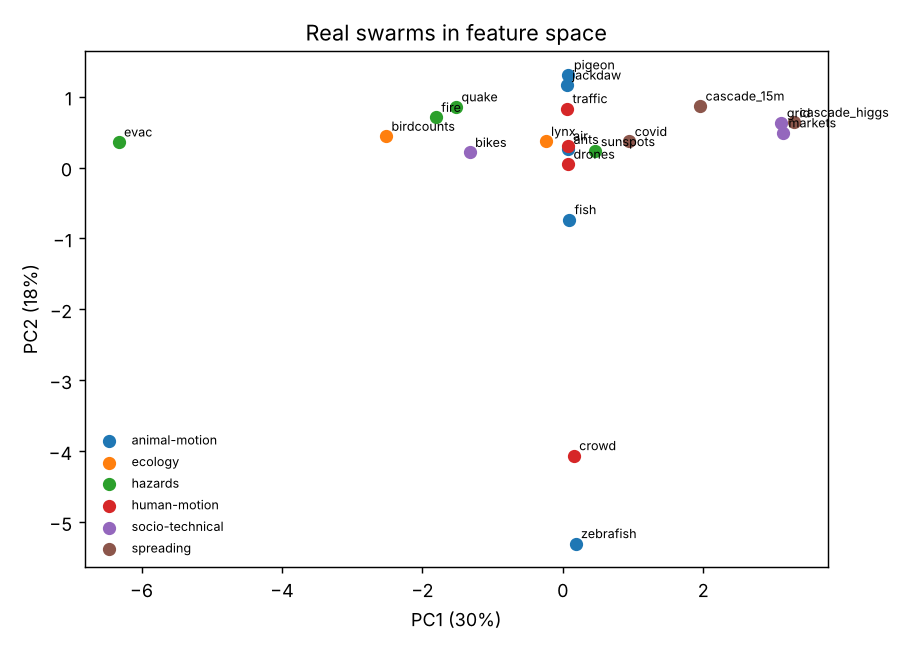
The three main characteristics. A principal component analysis of 20 measurements per dataset finds memory and regulation first (30% of the variation), speed regulation of moving agents second (18%), and burstiness and heavy tails third (14%). Four clusters cut across domains: ordered movers and oscillators (fish, birds, ants, traffic, aircraft, drones, COVID, quakes, sunspots, lynx, bikes), loosely ordered groups (crowds, zebrafish), bursty information and markets (cascades, grid, stock indices), and hazard spreading (fires, evacuations, bird counts).
Leaving out one whole domain group at a time never flips the sign of a constant, so no single domain drives the result.
Limits
- One pass per dataset so far. The constants do not yet have bootstrap error bars across recordings.
- Positions are recorded at different rates and with different tracking noise, and accelerations taken from positions are noisy. That is part of why the local rule explains so little of each single move.
- Sunspots, earthquakes and stock markets are complex systems without clear agents. They are included to test how far the law stretches, not because they are swarms.
Reproduce it
pip install -e ".[dev]" matplotlib openpyxl scikit-learn
python -m universal.fetch          # about 300 MB of public data
python -m universal.run_study      # about 1 minute
Nothing runs on GitHub Actions automatically. The code is MIT licensed.
What's next
- Bootstrap every constant over recordings, so each comes with an error bar.
- Add the large bird flocks (chimney swifts, starlings) once their data are downloaded by hand: the fluid-like equation needs hundreds of animals.
- Add Ontario and Alberta grid data and the Canadian wildfire database (CWFIS).